
A low website performance score usually comes down to render-blocking CSS and JavaScript, slow font loading, and an under-optimized caching setup, rather than the website’s content or hosting plan. Fixing these three areas, in that order, is what took one WordPress and Elementor site from a Lighthouse score of 71 to a perfect 100.
This isn’t a theoretical checklist. It’s a walkthrough of a real optimization project on a live business website, sandhystudio.com, including the exact diagnostics used, the changes made, and the measurable results. If your site’s performance score is stuck in the 60s or 70s despite good content and reasonable hosting, the same process below will likely apply to you too.

What Is a Website Performance Score, and Why Does It Matter?
A website performance score is a single number, usually from 0 to 100, generated by tools like Google Lighthouse to summarize how quickly and smoothly a page loads for a real visitor. It’s calculated from several underlying metrics, known as Core Web Vitals, rather than being one direct measurement itself.
The score matters for two connected reasons. First, visitors judge a website within the first few seconds; a slow-loading page increases bounce rate regardless of how good the content is. Second, page experience is one of the signals Google’s ranking systems take into account, especially when competing pages are similar in content quality. A higher performance score doesn’t guarantee a top ranking, but a poor one can hold an otherwise strong page back.
Understanding the Core Web Vitals Behind the Score
Before fixing anything, it helps to know what each metric actually measures. These three showed up as the main issues in this case study:
- Largest Contentful Paint (LCP) — how long it takes the biggest visible element, often a header image or heading, to fully appear. Good: under 2.5 seconds.
- First Contentful Paint (FCP) — how long it takes for any content at all, even a small piece of text, to appear on screen. Good: under 1.8 seconds.
- Total Blocking Time (TBT) — how long the page is unresponsive to clicks or taps because the browser is busy running JavaScript. Good: under 200 milliseconds.
Improve Website Performance Score on sandhystudio.com, all three of these were underperforming before optimization, which is what pulled the overall score down to 71.
How Do You Diagnose Poor Website Performance?
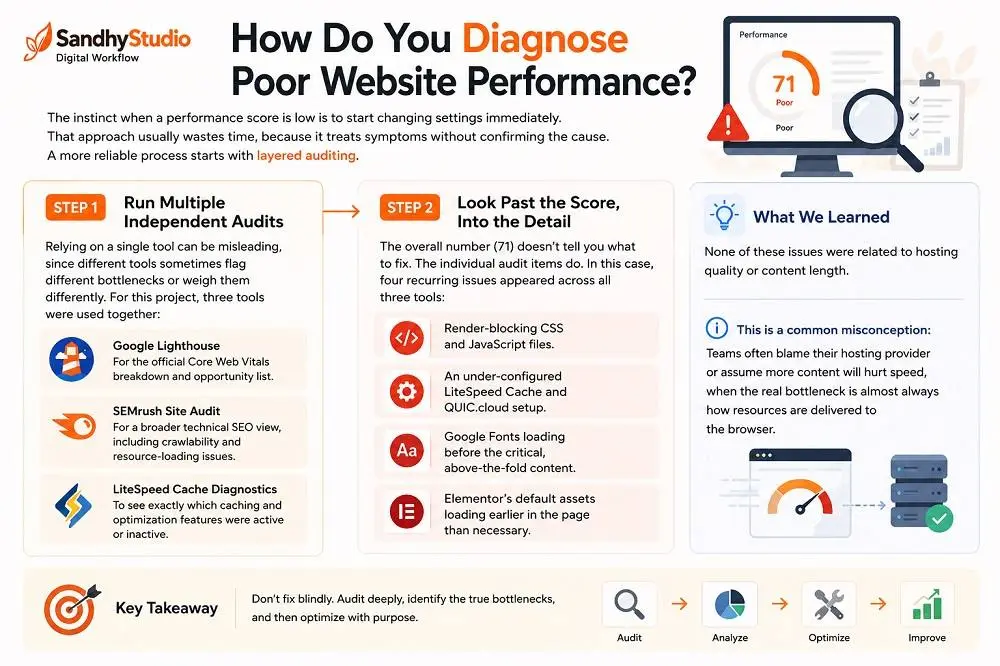
The instinct when a performance score is low is to start changing settings immediately. That approach usually wastes time, because it treats symptoms without confirming the cause. A more reliable process starts with layered auditing.
Step 1: Run Multiple Independent Audits
Relying on a single tool can be misleading, since different tools sometimes flag different bottlenecks or weigh them differently. For this project, three tools were used together:
- Google Lighthouse, for the official Core Web Vitals breakdown and opportunity list.
- SEMrush Site Audit, for a broader technical SEO view, including crawlability and resource-loading issues.
- LiteSpeed Cache’s built-in diagnostics, to see exactly which caching and optimization features were active or inactive.
Step 2: Look Past the Score, Into the Detail
The overall number (71) doesn’t tell you what to fix. The individual audit items do. In this case, four recurring issues appeared across all three tools:
- Render-blocking CSS and JavaScript files.
- An under-configured LiteSpeed Cache and QUIC.cloud setup.
- Google Fonts loading before the critical, above-the-fold content.
- Elementor’s default assets loading earlier in the page than necessary.
None of these issues were related to hosting quality or content length. This is a common misconception: teams often blame their hosting provider or assume more content will hurt speed, when the real bottleneck is almost always how resources are delivered to the browser.
Also Read : Apa Itu SEO? Panduan Lengkap untuk Pemilik Bisnis yang Baru Mulai Online
Step by Step: Fixing Render-Blocking Resources
Render-blocking resources are CSS or JavaScript files that the browser must fully download and process before it can draw anything on screen. Even a small file can add real delay if it loads at the wrong point in the page.
- Identify the render-blocking files flagged in Lighthouse’s “Eliminate render-blocking resources” report.
- Separate critical CSS, the styles needed for what’s visible without scrolling, from everything else.
- Load critical CSS inline or early, and defer the rest so it loads after the initial render.
- Move non-essential JavaScript to load after the page becomes interactive, rather than before.
- Re-run the audit after each change to confirm the fix worked before moving to the next file.
This single category of fixes had the largest visible impact on Largest Contentful Paint, since the browser no longer had to wait on unnecessary files before displaying the main content.
Improve Website Performance Score : Optimizing Google Fonts and CSS Delivery
Custom fonts are a common, overlooked cause of a slow First Contentful Paint. If a font file has to be downloaded before any text can be shown, the visitor sees a blank screen for longer than necessary.
The fix applied here had three parts: preloading the fonts actually used above the fold, using font-display settings so fallback text appears immediately while the custom font loads in the background, and removing unused font weights and styles that were being loaded but never displayed anywhere on the site.
Alongside fonts, enabling UCSS (unused CSS removal) trimmed a significant amount of dead weight. Elementor and many WordPress themes load a broad set of CSS rules by default, most of which apply to page elements that a specific page doesn’t even use.
Improve Website Performance Score : Deferring JavaScript Without Breaking Site Functionality
Deferring JavaScript is one of the highest-risk, highest-reward changes in a performance project. Done carelessly, it breaks sliders, menus, forms, or interactive widgets. Done carefully, it removes Total Blocking Time almost entirely.
The safer approach is incremental: defer one script, reload the live page, click through menus and forms, and only move to the next script once the previous change is confirmed safe. In this project, that discipline brought Total Blocking Time down from 230 milliseconds to 0, with zero functionality lost, because every change was validated individually rather than applied in a batch.
Improve Website Performance Score : Configuring LiteSpeed Cache and QUIC.cloud for Real Results
Installing a caching plugin is not the same as configuring it. LiteSpeed Cache ships with sensible defaults, but the settings that make the biggest difference, CSS/JS optimization, UCSS, image lazy loading, and QUIC.cloud’s CDN and image compression, are opt-in and need to be turned on deliberately.
For this site, the meaningful changes were: enabling UCSS specifically for template-heavy Elementor pages, turning on CSS and JS minification and combination where it didn’t conflict with Elementor’s own scripts, activating QUIC.cloud image optimization to serve modern formats automatically, and setting browser caching headers so returning visitors load the site even faster than first-time visitors.
Every setting was tested individually against a live Lighthouse audit, rather than toggled on in a group. That’s a slower process, but it’s the only way to know which specific setting is responsible for which specific improvement, and it’s what prevents a well-intentioned change from quietly breaking something else on the page.
The Results: Before and After
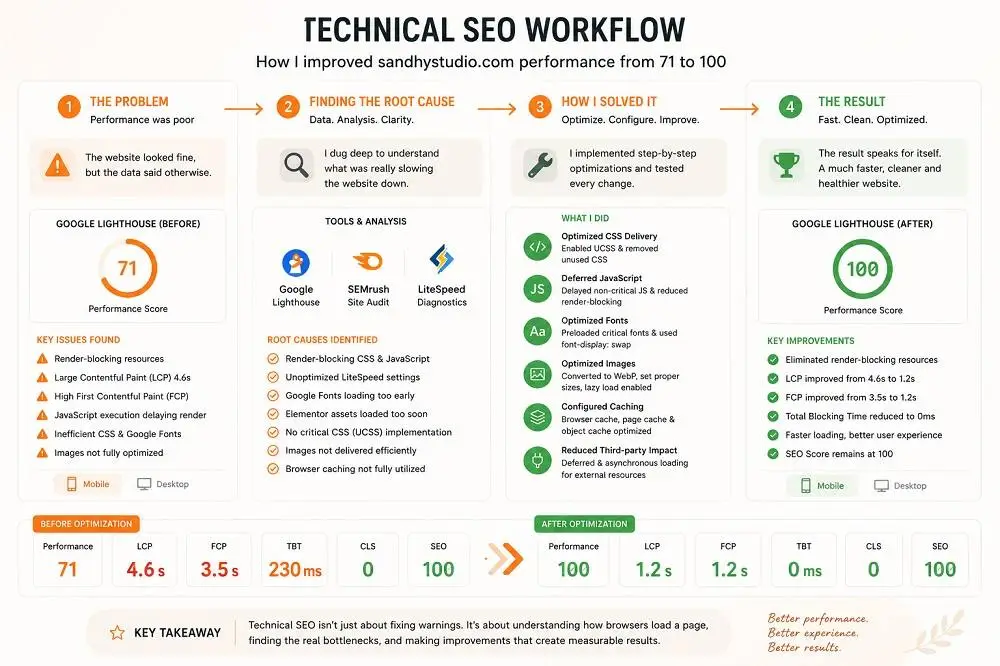
After completing the audit and applying the fixes above, in this order, the results were measurable and repeatable across multiple test runs:
| Metric | Before | After |
| Performance Score | 71 | 100 |
| Largest Contentful Paint (LCP) | 4.6s | 1.2s |
| First Contentful Paint (FCP) | 3.5s | 1.2s |
| Total Blocking Time (TBT) | 230ms | 0ms |
| SEO Score | 100 | 100 |
The SEO score stayed at 100 throughout the project, confirming that performance optimization does not have to come at the cost of on-page SEO fundamentals when it’s done carefully.
Common Mistakes to Avoid When Optimizing Performance Score
- Changing multiple settings at once, which makes it impossible to know which change actually helped, or which one broke something.
- Assuming a low score is a hosting problem before checking render-blocking resources and caching configuration.
- Enabling aggressive JavaScript deferral without testing every interactive element afterward.
- Ignoring font loading, which is one of the most common causes of a slow First Contentful Paint on content-heavy sites.
- Treating the performance score as the end goal, instead of using it as a diagnostic tool for real user experience.
- Skipping re-tests after each change, which leads to guessing rather than confirming what worked.
Does Improving Performance Score Actually Affect SEO Rankings?
Page experience, including Core Web Vitals, is one of several ranking signals Google’s systems take into account, and it tends to matter most as a tiebreaker between pages of otherwise similar quality and relevance. Improving a performance score from 71 to 100 is unlikely, by itself, to move a page from position 20 to position 1. What it reliably does is remove a technical disadvantage, reduce bounce rate, and support the other SEO work already being done on a site’s content and structure.
In other words, performance optimization is best treated as a foundation that supports content and authority-building efforts, not a replacement for them.
Improve Website Performance Score Optimization Checklist
- Run a baseline audit with Google Lighthouse and a second tool (SEMrush, GTmetrix, or PageSpeed Insights) to confirm the findings.
- Identify render-blocking CSS and JavaScript files in the “Eliminate render-blocking resources” report.
- Check whether Google Fonts or third-party fonts load before the main content — this delays First Contentful Paint.
- Review your caching plugin (LiteSpeed Cache, WP Rocket, or similar) for unused or default-only settings.
- Enable Unused CSS removal (UCSS) or a critical-CSS generator so only the styles needed for the visible page load first.
- Defer non-critical JavaScript so it loads after the page becomes interactive.
- Compress and lazy-load images below the fold.
- Re-test after every single change, not after a batch of changes, so you know exactly what helped.
- Confirm the SEO score and functional elements (forms, menus, sliders) still work after each optimization.
Frequently Asked Questions
What is a good website performance score?
A score of 90 to 100 on Google Lighthouse is generally considered good and reflects a page that loads quickly on both mobile and desktop. Scores between 50 and 89 need improvement, and anything below 50 is considered poor and likely to affect both user experience and search visibility.
Does website speed affect SEO rankings?
Yes. Page experience signals, including Core Web Vitals, are part of Google’s ranking systems, particularly for competitive queries where content quality is similar across results. A faster site also tends to have lower bounce rates, which indirectly supports SEO performance.
What is Largest Contentful Paint (LCP)?
LCP measures how long it takes for the largest visible element on a page, often a hero image or heading, to fully render. Google considers 2.5 seconds or faster to be a good LCP score.
What is Total Blocking Time (TBT)?
TBT measures the total time a page is blocked from responding to user input, such as clicks or taps, because the browser is busy processing JavaScript. A TBT of under 200 milliseconds is considered good.
What are render-blocking resources?
Render-blocking resources are CSS or JavaScript files that the browser must download and process before it can display any content on the page. Removing or deferring these resources allows visible content to appear faster.
Do I need to hire a developer to fix Core Web Vitals?
Not always. Many performance issues on WordPress sites can be resolved through caching plugin configuration, such as LiteSpeed Cache or WP Rocket, without touching custom code. More complex issues, like poorly coded themes or plugins, may require developer support.
What is Unused CSS (UCSS) and why does it matter?
UCSS refers to CSS rules that are loaded on a page but never actually applied to any visible element. Removing or deferring unused CSS reduces the amount of code the browser has to process before rendering, which improves load speed.
Can Elementor websites achieve a 100 performance score?
Yes, though it typically requires additional optimization since page builders load extra CSS and JavaScript by default. Careful caching configuration, CSS optimization, and reducing unnecessary widgets can bring Elementor sites to a high performance score.
How often should I audit my website’s performance?
A quarterly audit is a reasonable baseline for most small business websites, with additional checks after any major update to themes, plugins, or hosting configuration.
What tools are best for diagnosing slow page speed?
Google Lighthouse (built into Chrome DevTools), PageSpeed Insights, GTmetrix, and SEMrush Site Audit are commonly used together, since each tool can surface slightly different details about the same underlying issue.
Will optimizing for speed hurt my site’s design or functionality?
It can, if changes are made carelessly. Deferring the wrong script or removing CSS that is actually in use can break menus, sliders, or forms. Testing each change individually and reviewing the live site after every adjustment prevents this.
What is QUIC.cloud and how does it relate to LiteSpeed Cache?
QUIC.cloud is a content delivery and image optimization service that integrates with LiteSpeed Cache. It handles tasks like CDN delivery, image compression, and CSS/JS optimization that would otherwise need to be configured manually on the server.
Key Takeaways to Improve Website Performance Score
- A low performance score is usually caused by render-blocking resources, font loading, and caching configuration, not by hosting or content.
- Diagnosing the root cause with more than one audit tool prevents wasted effort on the wrong fix.
- Every optimization should be tested individually and re-audited before moving to the next change.
- A perfect performance score is achievable on WordPress and Elementor sites with careful, incremental configuration.
- Performance optimization supports SEO rankings as a foundation; it works alongside content and authority-building, not instead of them.